

Earlier this month, Anchor released redesigned analytics for their desktop dashboard. Now, they announced brand new mobile analytics. It lets Anchor podcasters see their analytics on the go.
Anchor’s redesigned analytics includes new features: Estimated Audience Size, Upgrades to current stats, and the ability to see where listeners are hearing you. Anchor podcasters were first able to view these new features in their web dashboard.
Estimated Audience Size is the average number of plays your episodes get within 30 days after publishing. Anchor says this is a great indicator of how many people are listening to your podcast.
Upgrades to current stats have also been implemented. The podcast plays chart in the Anchor dashboard now gives podcasters the ability to see which episodes are driving the most listens. Podcasters can now see when they published each episode and which episodes most contribute to peaks in your plays.
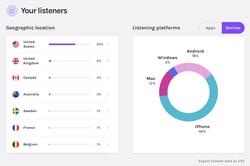
The Anchor analytics now have a listener geolocation chart that lists the countries around the world where an Anchor podcaster’s audience is hearing their podcast. It shows a breakdown of what platforms listeners are using to hear your podcast. There is also a way to sort your episodes list.
Anchor says that they had been asked to give podcasters the ability to see their analytics on the go through the Anchor app. As of March 21, 2019, the Anchor app has the same analytics information that podcasters can access through their web dashboard.