Focus on Blubrry Podcasting: Podcast Statistics

Blubrry Stats screenshot showing a set of headphones with the number 196726 below, with the text "total show listens" below that, and the text "443 episodes" at the very bottomThis is the first in an ongoing series that focuses on features provided by Blubrry Podcasting.

Whether you’re just starting out in podcasting or a longtime producer, it can be common to feel like you’re just speaking into the void. Is anyone out there? Are they really listening? The answers to these questions may seem difficult to find, but they’re not as complicated as you might think.

Is There Anybody Listening?
In the early days of podcasting, show producers had very few ways to determine if their shows were being consumed. Occasional audience communication like e-mail or social media connections were always gratifying. But direct feedback usually only represents a small percentage of any show’s total audience. To get a better understanding of audience size, it was necessary to sift through server logs, trying to parse raw data into something meaningful.

A Beacon of Hope
Blubrry was founded by podcasters with roots in the very beginning of podcasting. Growing with the medium, Blubrry understood the challenges faced by podcasters, including the need for audience measurement. That led Blubrry to launch its own podcast statistics platform in 2007. Blubrry Stats were immediately open to all podcasters, regardless of what platform they used to publish their shows.

Constantly Growing
The podcasting industry has changed a lot over time and Blubrry’s been right there, growing with it. Blubrry Stats started as a standalone offering and was later paired with Blubrry Podcast Media Hosting to provide the deepest insights possible from any podcasting platform. Blubrry Stats was also the first podcasting stats system to receive full Interactive Advertising Bureau (IAB) certification.

Options for All Podcasters
Blubrry offers three different tiers of podcast statistics:

  • Blubrry Free Statistics: A quick and easy solution for getting a snapshot of how many downloads your podcast is receiving and how/where people are consuming your show. Free Stats can be used with any podcast publishing platform that supports third-party stats providers.
  • Blubrry Standard Statistics: This version of Blubrry Stats is available for $5/month and is a big step up from Free Stats. Standard Stats allows you to compare episodes and see download trends across your entire stats history. Standard Stats unlocks Blubrry Media Kit, a great tool for promoting your show. This level of Blubrry Stats is also available as part of Blubrry’s $12/month Standard Media Hosting package, providing an affordable full-service podcast publishing solution.
  • Blubrry Advanced Statistics: Available with all Blubrry Advanced Media Hosting plans (starting at $20/month), Blubrry Advanced Stats provides the most comprehensive look at your show’s audience. Along with all of the features included in Standard Stats, Advanced Stats estimates total listeners/subscribers, provides listener retention/partial plays, and impactful play data.

Go Even Further
Knowing your show’s audience goes beyond just the numbers. Each tier of Blubrry Stats allows you to create Listener Surveys that can be used to gain more specific insights into your audience, like age/gender/economic demographics. Listener Surveys are anonymized on the listener side but the aggregate data they provide can help you to get the biggest possible picture of your show’s audience.

Leaving the Void
Sign up for Blubrry Stats today and start getting the full picture of your show’s audience. You’ll never again feel like you’re podcasting into the void!

How did Acast get 35 Million Dollars?

It continues to be shocking what investors fall for when it comes to investing in companies.  Acast had a Series C investment of 35 million. Yet the Acast numbers tell another story. Using feed analysis data provided by Daniel J Lewis the following tells an eye-raising story of what Acast has going on with the small number of shows they have.

Acast Stats
2.4K podcasts (0.4%) of Global Listings in Apple Podcasts
1.3K active podcasts (52.9%) have published an episode in 90 days.
1.1K inactive podcasts (47.1%) have not published an episode in 90 days
186 with 3 or fewer episodes (7.8%)
444 with 4–9 episodes (18.7%)
1.0K with 10–50 episodes (43.4%)
713 with 51 or more episodes (30.1%)
1.1K point to podcast page on media host (48.2%)

Yet they only had 2 million in revenue and now 155 million pre-money valuation. If you compare that to Libsyns numbers and revenue Libsyn reports Libsyn should have a market cap of around 3 billion which is a pipe dream as well.

Libsyn Stats
40.9k podcasts
25.3k active podcasts (62.0%)
15.5k inactive podcasts (38.0%)
3.3k with 3 or fewer episodes (8.1%)
6.5k with 4–9 episodes (15.9%)
18.2k with 10–50 episodes (44.5%)
12.9k with 51 or more episodes (31.6%)
18.3k point to podcast page on media host (44.9%)

This is not going to end well for the investors at Acast in our opinion.

Some Shocking Statistics

Daniel J. Lewis of The Audacity to Podcast has been doing some deep diving on numbers in the podcasting space looking specifically at shows in Apple Podcasts through their API and have come up with some stats that are absolute gold.  See more stats here.

Total Feeds
Almost 609K total podcasts in Apple Podcasts.

83K SoundCloud feeds
72k Anchor feeds
50K FeedBurner feeds
40K Libsyn feeds
28.3K Podbean feeds
27K Blubrry / PowerPress feeds
15.1K Spreaker feeds
8.2K Buzzsprout feeds
3.2K Simplecast feeds
2K Libsyn Pro feeds
1.1K podcasts.com feeds
1K Podtrac feeds
600 Fireside feeds

Some Interesting Metrics in relationships to the number of Episodes in the feeds

58K of the Anchor feeds have 10 or fewer episodes.
50K of the SoundCloud feeds have 10 or fewer episodes.
11K of Libsyn feeds have 10 or fewer.
A little more than half of all podcasts in AP have 10 or fewer episodes!
78.5K feeds in AP have only 1 episode!

When Daniel looked at the 3 or fewer episode metric per feed the breakdown even gets more wide-eyed.

42.4K Anchor feeds have 3 or fewer episodes
27.2K for SoundCloud
8.4K for FeedBurner
3.6K for Libsyn
3.3K for Blubrry / PowerPress
158.7K podcasts in all of AP have 3 or fewer episodes.

Overall Stats
263.3K (43.2%) of podcasts haven’t released an episode at all this year.

When Looking at Apple Podcast to see how many shows have the correct link back to there .com here is the breakdown.

-Of the 40.8K Libsyn-domain feeds in Apple Podcasts, more than half have their website properly set to something other than a Libsyn domain. Leaving 18.3K Libsyn-domain feeds pointing to Libsyn-domain websites. But without visiting every web page, that remaining number could contain any split between intentional an accident.

-SoundCloud has 83.3K domain feeds in Apple Podcast, and a smaller-than-I-expected-but-still-big 48.8K of those feeds have a Sound Cloud URL as the website.

-Anchor has 72,169 feeds in AP. All but 3 are pointing back to the podcast’s Anchor webpage and are not a podcast’s own branded website! (Edited by Request DJL)

He also looked at the total number of episodes across all feeds for the following companies an came up with these averages.

SoundCloud: 2,046,816 / average 24.5 episodes per show.
Libsyn: 1,980,221 / average 48.5 episodes per show.
Podbean: 789,113 / average 27.9 episodes per show.
Anchor  631,550 episodes /average of 8.8 episodes per show.
Spreaker: 613,082 / average 40.5 episodes per show.

There are some serious takeaways here we will update this article as he provides more data. Gives you some insight into what is really happening in the podcasting space.

Reality Check of RAD or Podcast Pingback Adoption

Let me state from the beginning that I am an avid supporter of the RAD initiative by NPR. Many of you may not be familiar with RAD, but to break it down in the simplest form it’s the measurement of client-side aka app playback data of podcast. RAD provides the ability for podcast measurement platforms to get info like when a listener starts, stops, scrubs ahead or back, and most importantly did an ad get played within the content.

The high majority of playback globally happens on a variety of apps of which most are well under 1% global listening marketing share on both Apple and Android. The exception is the Apple Podcasts App which dominates a huge percentage of the global consumption.

Since podcasts inception in 2004, podcast downloads are measured/filtered with server log data. Over the past several years, the IAB Podcast Measurement committee has worked with 30 plus podcasting companies to ratify podcast measurement guidelines that the podcast measurement industry uses today in reporting podcast downloads. While podcast metrics have been measured since 2005 with initial standards put in place in 2008 through the now-defunct Association for Downloadable Media, companies like Blubrry, Libsyn & Podtrac set those early standards of which many are rolled into the current guidelines.

Many of the companies in the podcasting space are not yet satisfied with the data provided with the current IAB guidelines and think that more advertisers will enter the podcast advertising space if this client-side data can be obtained through RAD.

I do not see Apple participating in RAD or any other initiative that exposes listener listening habits. With privacy concerns raging across the digital space plus the forthcoming GDPR regulations I see no way that some of the other big bigger players will be willing to participate in RAD even if the IP data is tokenized (anonymized).

I am all about data, and as a true data junky/podcaster, the more data we have to help podcasting as an industry move forward I’m behind. I will always support getting more information for podcasters to make informed decisions on their content to include information that they can use to monetize their shows. The lingering question I have is when do we have enough info, when do we go to far. Anonymizing the listeners is critical in any of these efforts.

So let’s assume that Apple is not going to play ball with RAD. Then that leaves us with 30-35% of the remaining global consumption across apps, websites and third-party sites that could be measured by RAD. This is assuming that 30+ podcast apps on iOS and Android add the RAD protocol to their apps. Which will take considerable development time on each app, plus testing with no financial benefit for the app developer. This will add overhead to their app, add data traffic load to their users. Plus each app will have to develop new TOS to inform users of this collection of play data, plus GDPR compliance for EU listeners. I cannot imagine them not giving a listener the option to opt out of this data collection.

I am not even addressing if Google, Pandora, and Spotify decide to play ball. Spotify, Pandora & Google Play are streaming platforms versus on demand.  Spotify has some of these play metrics already which helps but the data from them is unique in it’s own way and does not fit the download narrative or fit nicely into billing for advertising. Google based on recent interviews may not even have a mechanism to add RAD until they develop their own app as it appears Google Plays days are numbered.

One thing for sure the download is still and will remain king for a long time, and if we are lucky we will get a 10-15% participation rate in RAD which is still great information as it comes to data sampling and helps build the sales story confirming what we actually already know through other analysis methods. Any podcast measurement company worth its salt already can already trend how many subscribed listeners are listening and staying subscribed.

Add to this discussion a new entrant in the space has just introduced a competing protocol to RAD so while I applaud efforts of the Podcast Pingback group, in my opinion, they would have been better served to have added their voice to the RAD committee as all of their ideas are already on the table and have been for some time with the coalition of companies already working on the RAD spec.

I will say it again, I am a RAD supporter but do not want to sugar coat the hard work ahead to get us to the 10, 20, 30% adoption rate. 30% adoption would be a major win. I remain focused on improving the listener’s experience, that will drive listener volume. I would love to hear your thoughts on RAD in the comments below.

Todd Cochrane

Photo by Samuel Zeller on Unsplash

Bumpers is Shutting Down

Bumpers.fm is shutting down. Ian Ownbey, co-founder of Bumpers.fm, has a post on Medium that explains more about why they are shutting down both Bumpers.fm and Captioned.

Sadly we need to start the process of shutting down Bumpers & Captioned. We have been working to broaden podcasting for the last 3 years now and but due to lack of growth and funding we aren’t able to continue any longer.

They will leave Bumpers up until March 6, 2018. On that date, Bumpers will go into read-only mode for at least 60 days. Bumpers.fm strongly encourages people to move their content off of Bumpers (or download it locally) before March 6, 2018.

Captioned will be removed from the app store immediately. It will go into read only mode in 30 days.

Those who need to move their content off of Bumper.fm should read the Medium post for details about how to go about doing that. Their information explains a bit about how to move your Bumpers.fm feed to another host. It also has links that will help you download individual episodes. The Medium post also includes some suggestions for where to host your content.

The Holy Grail of Podcast Statistics Listener Listen Percentages

As promised, let’s talk about a topic I brushed on last month while I dug into the nitty-gritty of podcast statistics data: Listener-listen percentages, the holy grail of podcast statistics data.

By looking at the raw data of the media server logs, we can now calculate exactly how much of an individual media file was delivered to a listener. With a great number of podcast listeners simply clicking “play now,” versus downloading the file first, oftentimes the entire media file is not delivered.

When you click “play now” on most devices, the media is delivered to you in chunks, aka the infamous Byte Serving. Byte Serving is essentially — without getting too deep — how Apple and other mobile providers send you the media in pieces instead of downloading the entire file at once. Depending on your Internet connection and a lot of other variables, a 100 mb file could be broken up into 100 chunks on one request and 500 the next.

So if you listen to 15 minutes of a 30 minute podcast before clicking “stop,” there are many chunks / minutes of the podcast media file that have not yet been served to you. With this data we are now able to get an exact percentage of a file downloaded.

We can stitch those chunks back together and tell exactly how much, how little, or whether the file was served in it’s entirety. We have detailed data on each and every media file request.  It is pretty neat when we can see that a listener scrubs forward to, let’s say, the 10 minute mark and starts listening there instead of the beginning.

By now you can see where I am headed. The media delivery percentages really tell an incredible listener engagement story. To do this it takes a huge amount of processing to stitch, calculate and build sensible reports for our corporate clients. This data then allows them to do a lot of cool things. Here are a few:

*Make programming changes based on trends showing when an audience bounced out.
*Determine peak listening for ad placement before drop off.
*Provide accurate billing to advertisers.

One of our vendors had a show that lost about 80 percent of its audience each episode around the 23 minute mark. The producers knew that at that point in their program was a segment change. Upon removal of that segment, nearly their entire audience kept listening through to the 45 minute mark.

In another show, the audience scrubbed up — or jumped ahead — to about the 5 minute mark before they started listening. The show hosts revamped the beginning of their show and advertised the new change at the 7 minute mark, and regained the audience at the intro.

I want to be very clear here: This gives our clients inferred data on what is happening with each and every episode, no one to date is providing a signal that an app has been closed or the listener hit stop.  An assumption that they hit stop can be made, but may not always be the case.

The bottom line is that the listening session ended. If they come back later and pick up where they left off, we have other techniques that allow us to account for that action as well.

Simply watching the trending lines of the show’s audience over time has allowed our clients to tweak their shows, gain advertising revenue by better placement, and use a high level of sophistication to understand exactly what is happening with their listening audience.

For podcasters that host their podcast media with Blubrry, we will have an option to opt-in for similar data in their stats later this year, along with some yet-to-be announced data sets that will enable us to “close the loop.”

My goal in these first three articles has been to educate you that measuring media accurately truly is rocket science and we are pretty pleased to be the scientist behind that rocket. My team lives and breathes this everyday, and we hope that all networks and podcasters alike will trust us as tens of thousands of podcasters, networks and radio stations already do in their podcast media measurement.

Next month I want to switch gears and talk about mobile and the trends we are seeing in the utilization of mobile devices and even apps that are trending in the space. I will also cover some of the frustrations we have in tracking some of the mobile apps being used by podcasters today.

At Blubrry, we want to work together as a community to make sure that there are solid, reliable statistics and no misleading numbers in the podcasting space. If all podcasters utilized trusted solutions the space would be much better off in the long run.

Send your comments and questions to ceo@rawvoice.com

Catch my personal podcast @ GeekNewsCentral.com and tune in to our weekly New Media Show co-hosted with Rob Greenlee at NewMediaShow.com.

Unique listeners more important than you think!

This article originally appeared in issue #2 of Podertainment Magazine
Author:  Todd Cochrane CEO RawVoice Parent company of Blubrry.com

Hey folks! We’re going to get into the nitty-gritty of podcast statistics data. We know how confusing some stats can be, this is where I break it down for you.

I want to share a little history with you before I get into the topic at hand. I started my own podcast in October 2004 and as near as I have been able to figure it, my show was one of the first 50 or so podcasts to launch. In the early days, we were not worried about stats — our biggest challenge was bandwidth. There were no so-called unlimited bandwidth services.

Those hurdles were quickly overcome, and within a year we started focusing on who was listening, where and how. Today we have vibrant data that can tell us exactly how many people listened on the Web, used an app, or kicked back and watched on a set-top-box. Tracking the all of that now is an afterthought.

Two questions remain: Did they really listen and For how long?  I will share with you insights no one has to date revealed, data that is now 100 percent capable of being measured and will benefit you as you grow your show and your audience.

In a related article I provided some statistics that raised a lot of questions. We figured that might happen. This time, I have refined and broken down the data into chunks that are comprehensive.

With the RawVoice/ Blubrry podcast statistics reporting that we do for our clients, on every download / stream request, or “hit,” we analyze in great detail whether the hit should be counted as a download. With this precision analysis we can see out of range trends and account for that, as percentages fluctuate daily, show to show, episode to episode. With our proprietary algorithms we provide consistent podcast download totals regardless of what these percentages are on any given day.

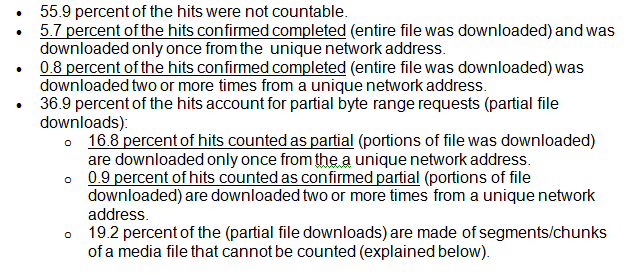
Given a random snapshot in November 2013, of 5,606,161 hits for media files ranging in size, we determined:

p3

Looking at the 55.9 percent of hits that were not countable, 22.4 percent ip duplicate requests, mostly caused by iTunes (iTunes may send one request to get the file size, then a separate to download the file). The remaining 33.6 percent stem from a variety of issues, such as invalid HTTP status code, empty byte range request size, non-existing files, invalid file name (non-podcast media), etc.

When we see partial download requests, we take the time to assemble the bytes requested to determine how much of the file was downloaded. In some cases, we will only see one or two requests from the same unique visitor, and in other cases we see hundreds of small byte range requests from a unique visitor. Factoring in the byte-request data we know exactly what portion of each file is requested, allowing us to calculate how much of the file was downloaded. Of the 19.2 percent partial file downloads they make up small segments aka repeats of portion of a file already counted we do not count those partials as they have been accounted for in the other confirmed downloads.

We reported 24.2 percent as counted downloads (underlined totals), with 22.5 percent being from unique IP addresses, leaving only 1.7 percent of the hits accounting for two or more downloads. The end result shows us that two or more downloads coming from the same IP address is very low.

Any given day, the percentage breakdown of countable and not-countable downloads fluctuates based on many factors. If you rely solely on download hits, you will find that your numbers will not be consistent and will not reflect your true download total or audience size.

It is important to note that unique IP address data is critical validation data for podcast media downloads. Based on the results above, we know that the final download / stream total will always be higher than and relatively close to the unique IP address total. We (Blubrry/RawVoice) knew this back in 2005 when we started measuring podcast downloads, and as you see from our small snapshot from November, it still holds true today.

If you are concerned about being audited or need accountable details to meet the Sarbanes-Oxley Act, make sure your podcast measurement is taking the necessary steps to calculate the true download total.

Here is where I am going to get up on my soap box for just a moment. If you are counting your downloads with anything other than a trusted podcast statistics platform, you are likely over-reporting your total audience size. It’s complicated stuff. Get the unique IP count correct by throwing out the garbage and you will find that Unique IP is a large indicator of true audience size. This is evident, as we’ve noted above, because we do not see Unique IPs coming back very often for the same file.

In a future article, I will translate the percentages into describing what we are seeing in an actual listening rate. With Byte Range being used nearly exclusively in the space, we can tell you based on server data just how long they are listening to your show.

If you desire your podcast network to get on track and have media statistics that keep you honest, feel free to reach out to me at ceo@rawvoice.com. We host and measure the biggest podcast networks in the space

Podcast RSS Feed Survey Results

Recently there has been mis-information being put out by a commercial podcast hosting company claiming that Podcast RSS feeds hosted on WordPress sites is a bad idea. So a week or more ago I asked podcasters a series of survey questions about their Podcast RSS feed to get podcasters to weigh in on the topic.

The recent shutdown of Mevio giving podcasters 10 days to move, will hit home here in the importance of controlling ones rss feed. I look forward to seeing your comments on the results of the survey.

Here are the survey results a total of 1180 podcaster participated.

1. Number of years you have been Podcasting

1 – 31.03%
2 – 12.07%
3 – 8.62%
4 – 6.90%
5 – 5.17%
6 – 5.17%
7 – 5.17%
8 – 8.62%
9 – 15.52%
10 – 1.72%

2. Do you have your own Website aka YourDomain.com

Yes – 98.28%
No – 1.72%

3. Where are you hosting your actual Podcast Media?

More than 95% where hosting at one of these 4 services (Amazon s3, Blubrry, Libsyn, Self Hosting)

4. Do you use WordPress?

Yes – 94.14%
No – 5.86

5. Do you use a Podcasting Plugin if so which one?

None – 5.51%
PodPress – 1.1%
PodLove – 0.7%
PowerPress – 92.39%
SoundCloud – 0.2% (Not a plugin)
Others – 0.1

6. What RSS Feed are you using to feed iTunes?

The RSS Feed from my own website – 77.57%
The RSS Feed from Feedburner – 18.21%
The RSS Feed from my Hosting Provider – 4.22%

7. if you answered my Hosting Provider or Feedburner do you have a plan to recover your RSS feed / Audience if they go out of business or stop the service?

Yes- 33.01%
No- 66.99% (I find this number simply Incredible)

Comments. (Currently moving to PowerPress | Newsletter – copies of all eps – social media – website announcement | Going to switch the feed soon to my own site | Redirect via iTunes| 301 redirect from Feedburner | I’ll cross that bridge when I come to it.| Beg Apple to update my feed)

8. On a scale 1-10 with 10 being the highest how important is it that you control your own rss feed?

1 – 0.00%
2 – 0.01%
3 – 0.01%
4 – 0.01%
5 – 1.45%
6 – 1.57%
7 – 1.77%
8 – 5.34%
9 – 5.61%
10- 78.79%
A third party controls my RSS feed 5.17%

9.If you are a WordPress user have you ever had a problem with your Podcast RSS feed?

Yes – 2.07%
No – 92.16%
N/A – 5.77%

Comments on Question 9 only received 4 from the 1180 respondents. (The feed got too large, over 512k.| Had to have it fixed by a developer! $$$. I think it was a bad plugin! | A plugin messed up the RSS feed on a client’s site.| My feed went invalid due to you tube videos | The last time it went invalid I gave up (it was a pluigin, and the show is almost dead) and changed my feed ti Libsyn.com as it worked.)

10. Have you ever used a third party service for your RSS feed and have had issues?

Yes – 10.34%
No – 89.66%

Comments: (Their site went down for an extended period | Feed burner stopped working -also stat reporting failed | Feedburner wouldn’t update – Also used Libsyn for a while and the feed quit a few times | I did have trouble when I controlled my own feed. This still bugs me! | Libsyn jacked my feed and their support was slow so I switched to my own feed)

11. For those that control their RSS feed on their own website have you ever regretted doing so?

Yes – 2.02%
No – 97.98%

12. What advice would you give a new podcaster that is starting out today when it comes to their RSS feed.
Note: We received over 900 responses to this question alone I have tried to cover all themes.

Control it, use your own. When submitting to iTunes and other podcast directories use a podcast only feed, not the main site feed.
Control your own so that you have the ability to seamlessly pull away and move at your leisure.
Generate your own feed via WordPress.
Use Powerpress, own your feed.
Control it yourself…..
Have your own and that it’s a podcast only RSS feed.
Use your own site!
If you’re using a “free” service that doesn’t give you control over your own feed make sure you run it through Feedburner so you can keep some control over it.
Get your own and keep it simple!
Control your feed it is your brand and audience.
Host your files on Libsyn and use your rss feed from your WordPress blog using Poweerpress
Trust the professionals
Understand how to control your own RSS feed or no how to redirect it should you need to before launching your podcast.
Keep it on your own server. Validate using FeedValidator.
use a third party
Just know what it is, where it is, and how you can access and modify it.
Use Libsyn
Always control your own RSS feed. It’s the lifeblood of your podcast.
Use Blubrry Hosting + WordPress and PowerPress

I want to thank the podcasters that took the time to answer this survey. We will be running more surveys in the future.

Let’s dig into Podcast Statistics

As part of my fiduciary duty at RawVoice, I am required to make sure all of our advertising campaigns are reporting and being billed correctly.  Having highly accurate reporting is priority number one to me so that we can pay our podcasters on ad deals fairly, but also to ensure our advertisers are billed only what we have delivered.

I love statistics; it was one of my favorite courses in college so I often drive my team members crazy by asking them to calculate a weird stat or explore a new trend. What I aim to do in this series of articles is answer questions you might have on podcasting trends and provide you helpful insights. Feel free to reach out to me via the contact info on the site to send me questions.

Today, I want to talk on two topics: Truth in reporting podcast statistics; and a new statistic we’re calculating for our corporate clients that shows what percentage of a media file is actually streamed and / or downloaded.

I have been managing podcast ad deals since 2005 and have seen the good, bad and the ugly.  My sole philosophy when it comes to podcast stats is simple: I don’t care what the number is so long as I know what the true number is.

Truth in Reporting.

A week does not pass without someone contacting me to tell me they have 100,000 listeners per episode and want to work with us on securing advertising. My response to them has always been to get on our stats and we will talk in a couple of weeks. Often, the follow-up discussions are spent explaining to them why their audience size assessment was inaccurate.

The past couple of years we have been involved in the audits of podcasters’ reporting data that has more times than not ended disappointingly for the podcaster. It is not usually negligence on their part, rather their trust in a home-grown tool, or some non-podcast stats system.

Let’s look at the impact of improper reporting. If a podcaster was audited to have delivered 100,000 downloads from a trusted stats system, yet had originally billed for 500,000 from a system they employ, this will significantly, negatively impact the performance of the campaign, not to mention the cash that has to be returned to the media buyer.

The podcaster may be denied a follow-on campaign, whereas they may have extended the campaign had the initial reporting been accurate. These situations cause advertisers as a whole to lose faith in podcast advertising.

What constitutes a trusted stats system? From experience, we know that we have to tweak our stats engine weekly to keep up with all the bots, rouge apps, bad code and the overall deviations on the Web. We also know you need volume to see trends. For instance, we found a recent update of a browser that was causing bloated numbers — without weekly monitoring that would have caused inflated data.

If you have created your own solution, and it does not have the scale/volume and safeguards to see and flag trends such as a single-browser version inflating calculations, over time issues such as this will compound and cause inaccurate numbers reporting, both high and low. Most shows and networks do not have the time, traffic volume or staff resources to track such changes.

Media buyers are already starting to ask hard-hitting questions, and some are implementing or contracting statistics solutions that require podcasters to be on the media buyers’ tracking and stats system. You do not want to be on the wrong side of reporting numbers when an audit puts you in a position that could have a negative financial impact.

If you are a member of a network and they are doing ad deals for you, your reputation could be damaged by improper reporting, so always question the network leadership about how the podcasts statistics are being determined. As important, ask questions of your existing stats provider.

How much of a media file is being streamed / downloaded?

We recently did some research that we revealed at the New Media Expo this past January. We have been studying activity that can be broken into five categories detailing what occurs when a media file is queried. We found the following information that should give you some new insights into media consumption.

To do this, we took a snapshot of a network of podcasts, episodes in this network had billable downloads ranging from 2,000 downloads to 120,000 downloads per episode. We took a one-month sample of every episode / show and averaged out the totals below.

-55.9 percent of downloads where uncountable (duplicate, repeats, bogus)
-5.7 percent were unique IP completed downloads
-.8 percent were repeat completed downloads
-17.7 percent unique IP partial downloads (2 percent-99 percent)
-19.9 percent repeated partial downloads (2 percent-99 percent)

Now these numbers may shock you, but take into account that the network ended up having more than 5.60 million billable downloads.

In future posts I will go much deeper and explain details on each of the above data points. What I want to impress upon you today is that unless you have specifically coded a filter for requests that are duplicate, repeats, bogus, etc., it is easy to understand how a show could end up with 55 percent more reported downloads than actually occurred.

Todd..